- Free Rental Applications - 20+ Free Landlord Forms - Create Legal Documents in MInutes - Print Instantly - Download and Save - Created by Staff & Legal Professionals
Equity REITs can be valued based on several measures. Price to NAV is one that gets less discussion.
Our charts break down the sector using FFO multiples and price to NAV ratios.
The discounts to NAV can be very appealing when they apply to large apartment REITs with great management and conservative balance sheets.
We like AVB, EQR, and ESS here. Each apartment REIT has a great balance sheet and strong management team along with a large discount in the price.
Looking for a portfolio of ideas like this one? Members of The REIT Forum get exclusive access to our model portfolio. Get started today »
This research report was produced byThe REIT Forum with assistance from Big Dog Investments.
Thanks to the success of our public series on mortgage REITs, we’re testing a series on equity REITs. Your feedback on the layout is greatly appreciated in the comments section.
If the series is a hit with readers, we will look to expand on it. If not, it fades into the night. The goal of this series is to allow us to rapidly inform readers about the things we are seeing in any given sector (always some kind of REIT). At the same time, we will include some charts and tables to provide readers with raw data. Our commentary after the data explains what we’re seeing.
Note: FFO multiples use a median forecast simply labeled as “FFO” for the current year. NAV ratios use trailing values for the median analyst estimate. If there is no median analyst estimate or if I believe the estimate is unreliable, I may exclude it to avoid reproducing data that I believe is materially inaccurate.
Further, I’m conflicted about including a few of the REITs here. UMH is technically a MH Park (Manufactured Home Park) REIT, but is hardly comparable to ELS and SUI. Likewise, APTS has a much more diversified portfolio. Someone could argue that they belong in the “Diversified” section rather than being grouped in as “Apartments.”
Prices
Prices in the table and used for the chart were pulled on 6/29/2020 during market hours. Consequently, they won’t be a perfect match for closing prices.
FFO Multiples
The next image provides a graphical representation:
Source: The REIT Forum
Remember that consensus FFO estimates could be influenced by non-recurring factors. Some readers might suggest we avoid that by using AFFO estimates, but that doesn’t solve the entire problem either. What we really need is to be using “Normalized FFO” or “Analyst AFFO.” To really pull that effectively, you need every analyst precisely on the same page regarding their estimates. Even if you can do that, some analysts are content to simply regurgitate guidance plus or minus one penny.
If readers frequently request a price to AFFO chart in the comments, I’ll look at adding that in also. Presenting both values could certainly be useful.
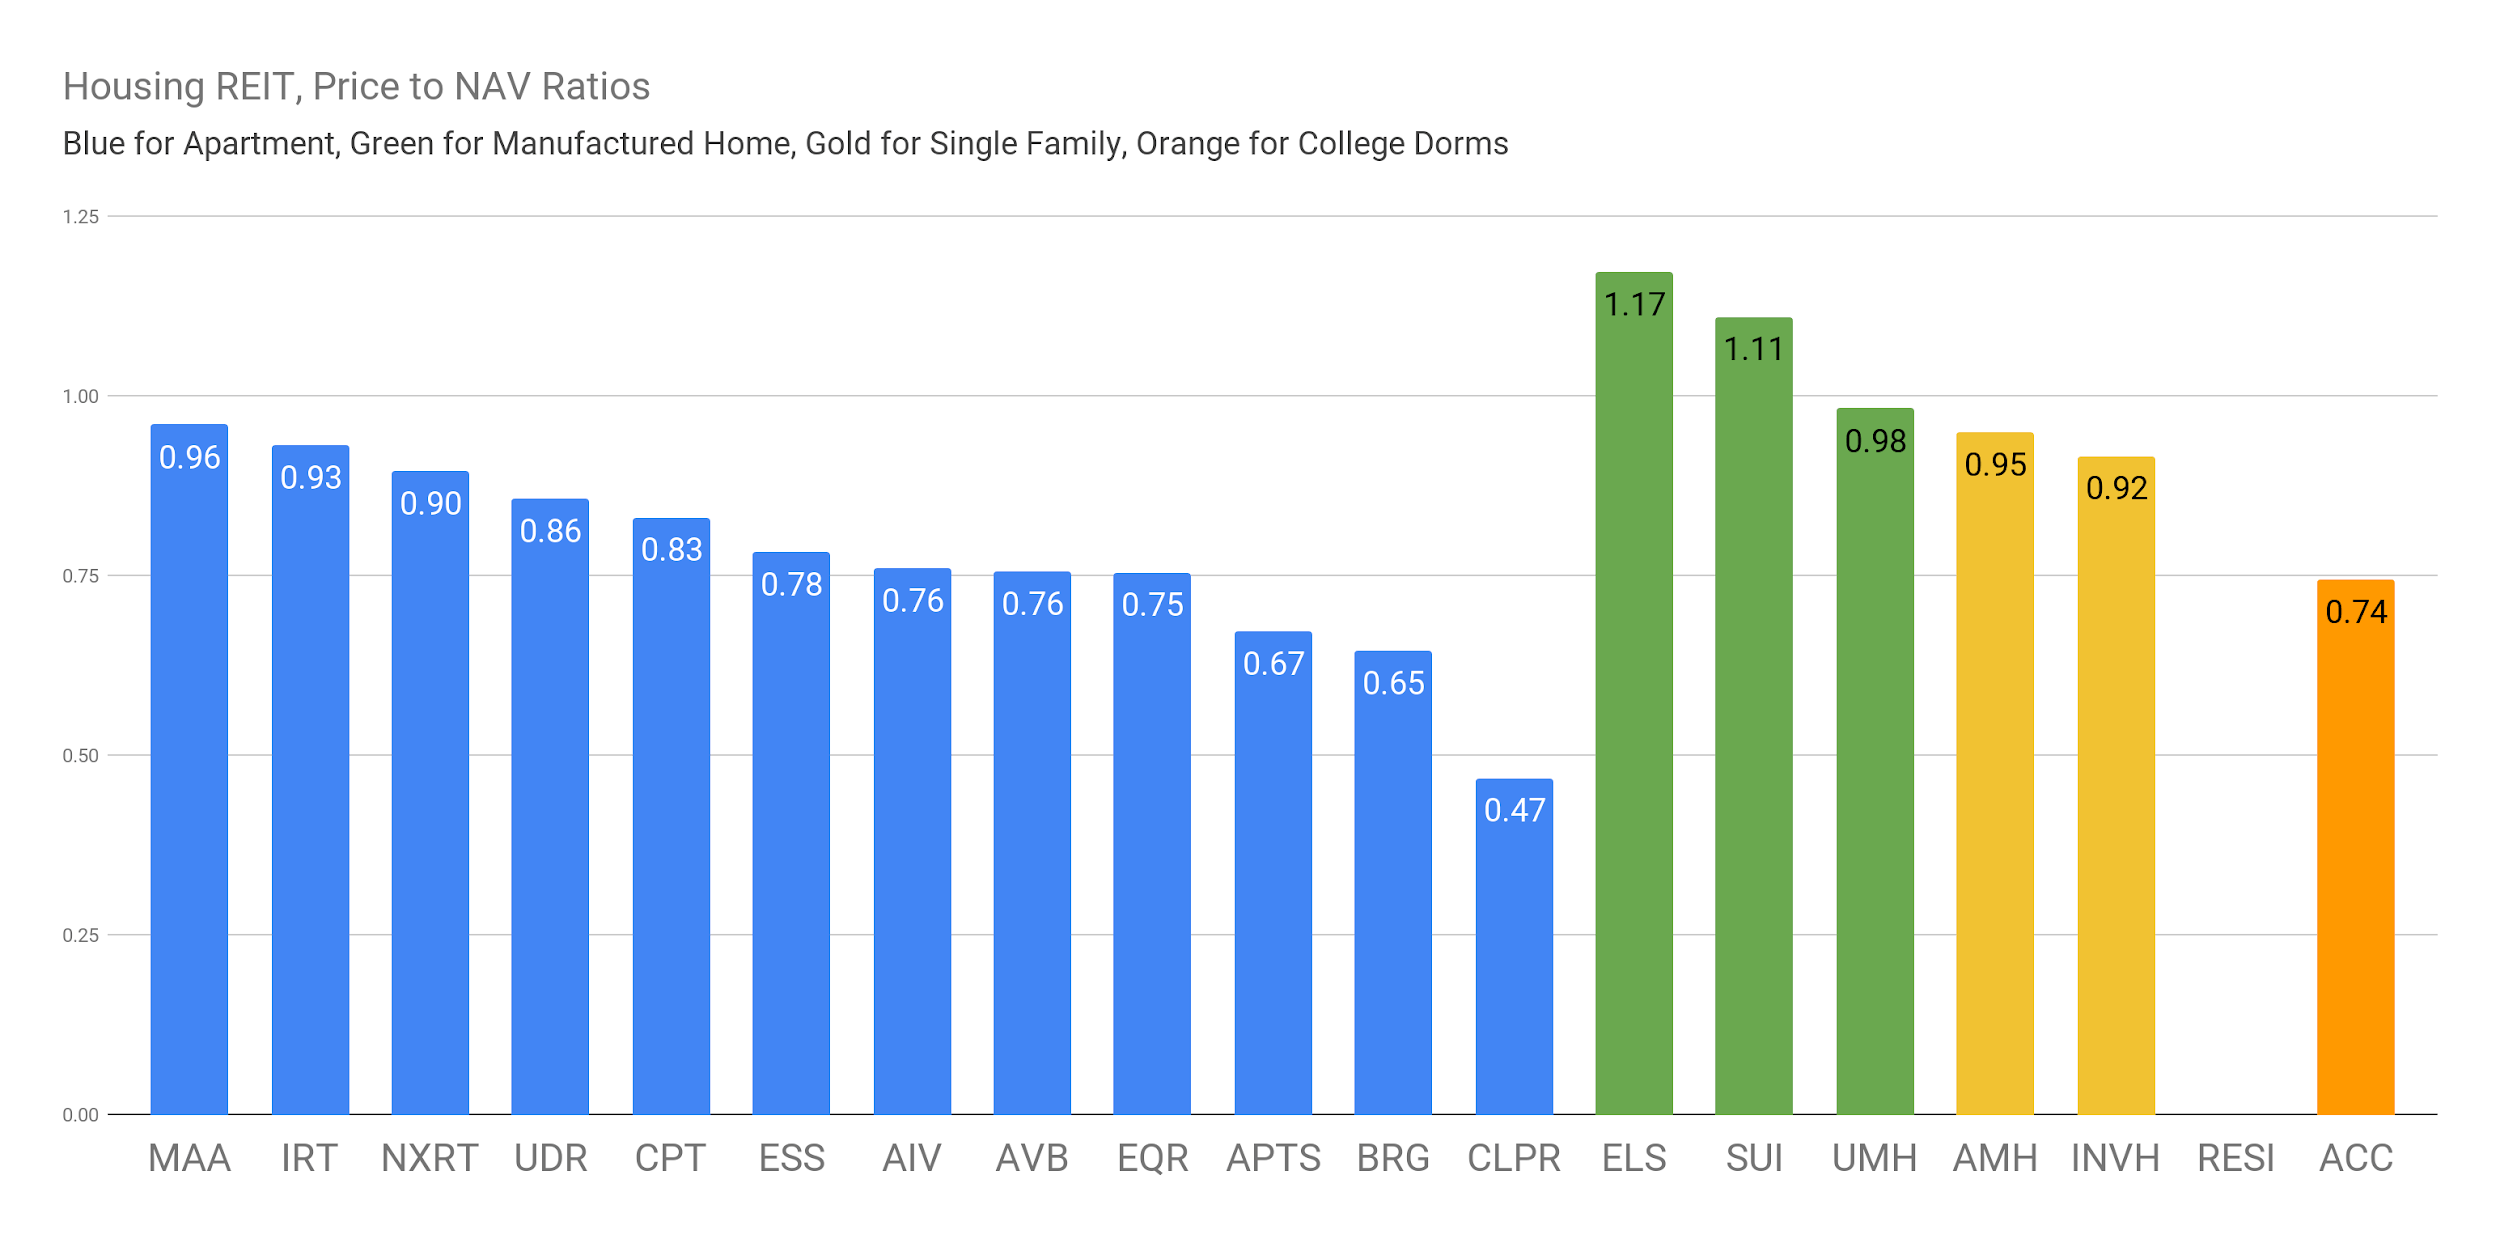
Price to NAV
Here’s some data you’ll have a hard time finding. It’s the price to NAV estimates. Many retail investors struggle to find any information on consensus NAV estimates. You can’t calculate a number if you don’t have the numerator. We used the same sequence for colors, but the REITs have been sorted again for price to NAV:
Source: The REIT Forum
We excluded the value for NAV for RESI. We argued that NAV for RESI was dramatically lower than the consensus estimate for a couple of years. When a buyout was announced (since scrapped), it valued the company at $12.50 per share. Is $12.50 roughly the same as the consensus estimates (around $18 at the time)? No. It isn’t roughly the same. It isn’t close. The buyout was announced on Feb. 18, 2020. That’s slightly BEFORE the sector peaked, so don’t give some story about a distressed sale.
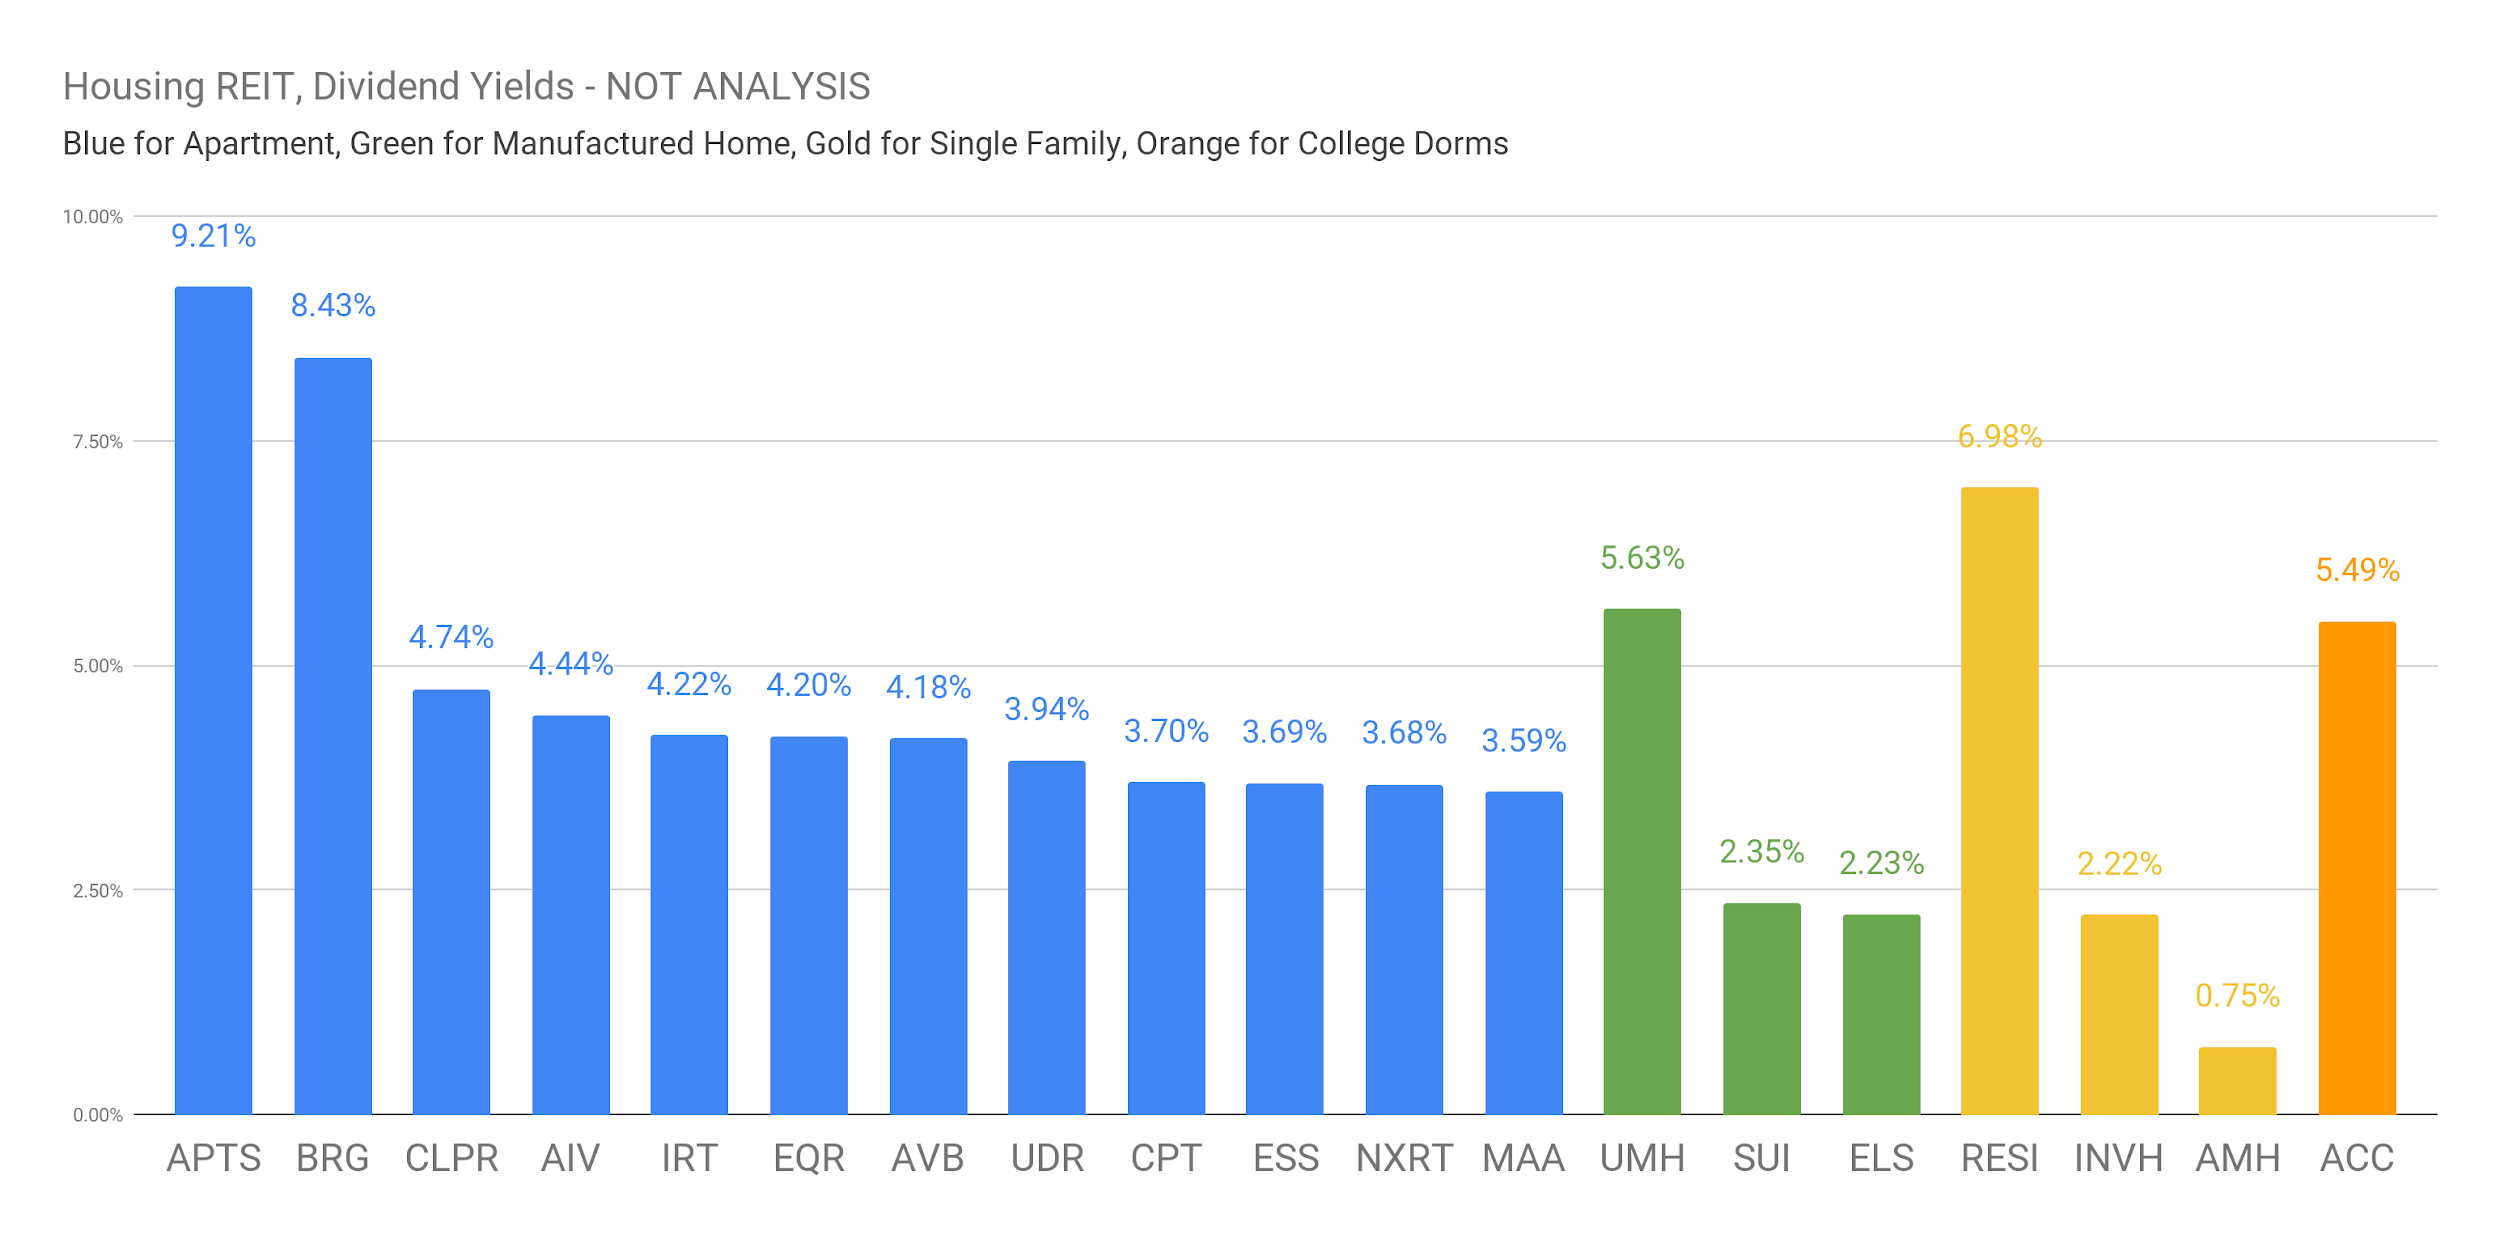
Dividend Yields
Sorting the REITs by dividend yield is absolutely not analysis. We will show the dividend yields, but investors absolutely should not use the chart to make decisions. We are including it solely because it is of interest to readers:
Source: The REIT Forum
We may at times miss the most recent updates to the dividend amount. It’s critical for readers to understand that picking a REIT by the dividend yield is one of the worst options available for investors. Many investors end up underperforming because they focus on the dividend yield rather than the quality of the underlying company. Don’t do that.
Many investors think they’re doing much better by simply checking the payout ratio against FFO per share. That isn’t doing enough due diligence either. Remember that FFO per share doesn’t adjust for recurring capital expenses and those can be dramatic.
Brief Note
We don’t actively cover every REIT within this sector. There are a few that we rarely cover, those are NXRT, IRT, BRG, APTS, CLPR, UMH, RESI, and ACC.
Unique Commentary
We want to briefly highlight three options in the apartment REITs. We believe each of these is a great choice for building wealth over the long term. These are great REITs. They have great management, solid properties, and excellent balance sheets. They are running the REITs the right way. The three we’re highlighting, all with bullish ratings, are:
AvalonBay Communities
Equity Residential
Essex Property Trust
AVB
There’s very little for investors not to like about AVB:
The REIT carries a risk rating of 1, reflecting their exceptionally low leverage. Our risk ratings correlate strongly with credit ratings. A risk rating of 1 generally means leverage will be comparable to an A- credit rating. A risk rating of 1.5 is more suitable for a BBB+ credit rating.
AVB excels in development, which can scare some investors off. After all, they see an environment where REITs won’t want to be starting in on new development projects. Clearly, this isn’t the ideal time to start new construction. There’s a great deal of uncertainty, which is generally bad for construction.
However, investors are getting expertise in development for free. The shares trade at a substantial discount to the estimated NAV for the REIT. Even if the private party values for apartments decline (entirely possible), investors have a significant margin of safety built in.
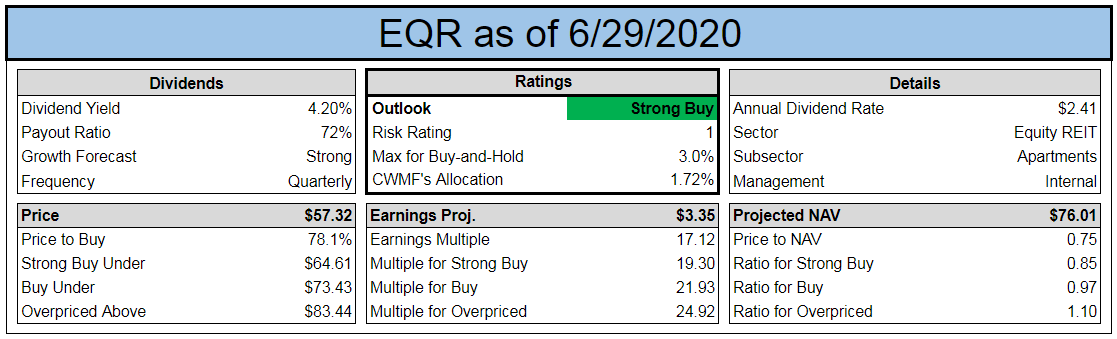
EQR
You get a big discount on EQR as well:
Source: The REIT Forum
That’s a trend you’ll notice for our buy ratings here. We’re picking shares where the REIT trades at a huge discount to NAV and has a very conservative leverage profile. We don’t want to be owning REITs where the debt is going to force them into bad decisions.
So why is EQR on sale? Investors are generally a bit concerned with apartments in the current environment. They see headwinds to rent collections. Those headwinds exist, but the apartment REITs are generally collecting rents quite well. We see that as overblown.
Rental rates may be a bit weak for the next year as well. That isn’t a long-term expectation, just a short-term headwind. Investors are getting a solid dividend while they wait.
ESS
Let’s look into ESS next:
Source: The REIT Forum
ESS focuses exclusively on the West Coast. It’s a combination of California and Seattle. Management is exceptional and investors can learn a great deal by listening to their earnings calls. They’ve even provided guidance on how California could actually solve their “housing crisis.” Can you guess the answer? It’s pretty simple: Allow densification and construction. The low level of new permits issued each year keeps supply low. If supply kept up with demand, rental rates wouldn’t be soaring higher year after year.
Do you believe rents in California will stagnate over the next decade? I don’t. I think rental rates will continue to climb. There will be pauses in the growth and some years will look better than others, but the general trend will most likely be higher. If rents trend higher, then NOI trends higher. That drives growth in FFO per share, which enables dividend growth. ESS knows a thing or two about that. They already broke 25 consecutive years of dividend increases.
Conclusion
Housing REITs can provide a much better opportunity than a direct investment in real estate. That isn’t always the case, but it can be. You need to evaluate when the high-quality REITs are trading at discounts. Don’t sacrifice quality just to get “cheap” (low multiple, low price-to-NAV, or high dividend yield). That’s been a losing bet for a long time in this sector.
In this case, we have three of the very best apartment REITs trading at very significant discounts to NAV. The last thing you should want is to be paying full price for an apartment building right now. You’ve got a much better opportunity. These apartment REITs give you several benefits:
Excellent management to run the portfolio
The REIT’s lower cost of debt (you can’t borrow at the rates they get on bonds)
A dramatic discount to the private party value of the apartment buildings
Liquidity from the shares being publicly traded
Ratings:
Bullish on AVB, EQR, ESS
We are the only large REIT Research service on Seeking Alpha with:
A CPA on the team.
A record going back to the start of 2016.
A real-money portfolio worth over a quarter-million with full disclosure on every trade.
Real-time notifications on every purchase and every sale, including exact share count, purchase price, dividends earned, and sale price.


 Accessibility