- Free Rental Applications - 20+ Free Landlord Forms - Create Legal Documents in MInutes - Print Instantly - Download and Save - Created by Staff & Legal Professionals
Based on today’s values, the highest priced home a renting household with student debt could afford is $269,400. A renting household without student debt could go as high as $361,800.
33.9 percent of renters looking to buy in the next year have some form of student debt.
Those with student debt can afford 52.3 percent of homes across the country, at a maximum price of $269,400.
With mortgage rates on the rise, affordability is a growing concern for renters looking to build or increase their wealth through homeownership. And those with student debt face a steeper climb.
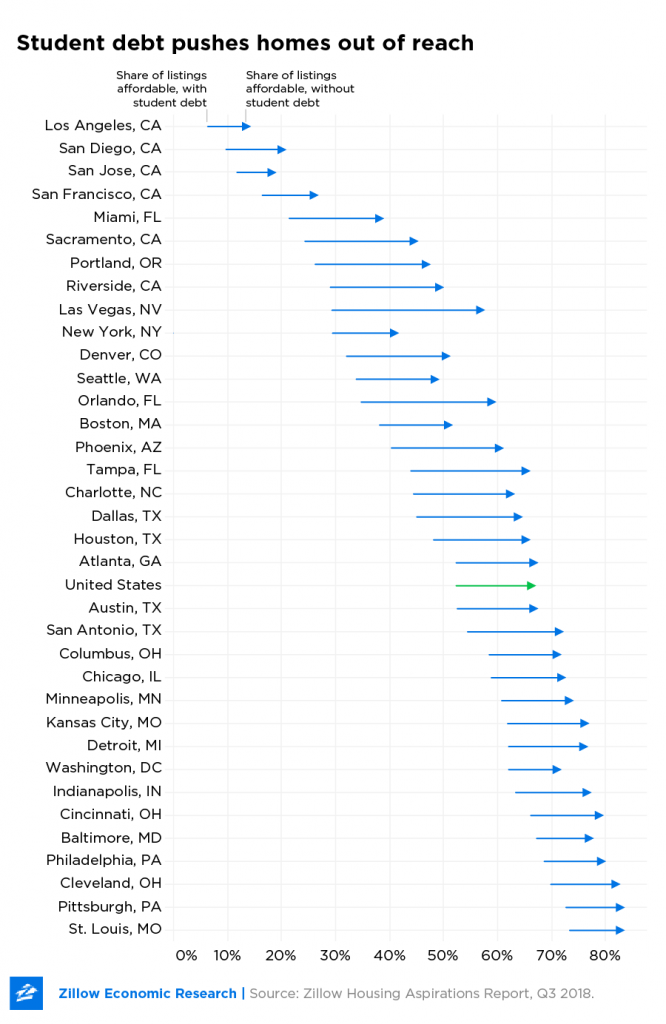
While a family earning the median household income can afford to buy 66.4 percent of homes currently listed for sale, those with student debt can afford just 52.3 percent.
Slightly more than a third of renting households – 33.9 percent – who plan to buy a home in the next year have some form of student debt, according to the Zillow Housing Aspirations Report. The majority of those are paying off debt of their own, but others are supporting their spouse, children, grandchildren, and/or someone else.
Student debt also reached record levels this year, totaling $1.56 trillion in the third quarter of 2018. The average monthly student debt payment for renters is $388. Even before it limits the number and price of homes renters can afford, student debt makes it harder to set aside money for a down payment, which is one of the top barriers to homeownership in the eyes of renters. What’s more, saving for that down payment now takes longer than it did for previous generations.
This means that if they want to live affordably – that is, spend no more than 30 percent of their incomes on a mortgage plus student debt payments – those households would have to limit their search to homes $92,440 less expensive than renting households that have only the mortgage to pay. Based on today’s values, the highest priced home a renting household with student debt could afford is $269,400. A renting household without student debt could go as high as $361,800.
Using metro level median incomes and home values, the gap results in a substantial difference in the number of homes within reach. For renting households in Las Vegas, having student debt decreases the number of affordable homes available by almost half, from 57 percent to 29.3 percent. There are six additional major metros where the difference between the share of homes affordable to those with student debt and those without is greater than 20 percentage points. In Orlando, Fla., where the median household income is just over $55,000, renting households without student debt can afford 59 percent of homes with an upper price limit of $328,200. Those with student debt can afford just 34.7 percent of homes, with the upper limit at $235,800.
Student debt has the least impact on affordability in San Jose, Calif., the nation’s most expensive housing market, largely because the median income can buy so few homes to begin with. Renting households with the metro’s median income of over $118,000 can afford just 18.3 percent of all homes in the metro with a maximum price of $703,200. For those with student debt, it’s 11.7 percent. Los Angeles has a similar story, with renting households without student debt able to afford just 13.5 percent of listings, a small share that falls to 6.3 percent for those with student debt.


 Accessibility