Room for Rent: Exploring Rental Vacancy Rates in Urban, Suburban and Rural America
- The rental vacancy rate fell to historic lows in the nation’s urban communities in 2016 according to the U.S. Census Bureau, while remaining stubbornly high in more-rural areas.
- Rental vacancy rates overall remain low, but eased somewhat in Northern California the Northeast and parts of Florida.
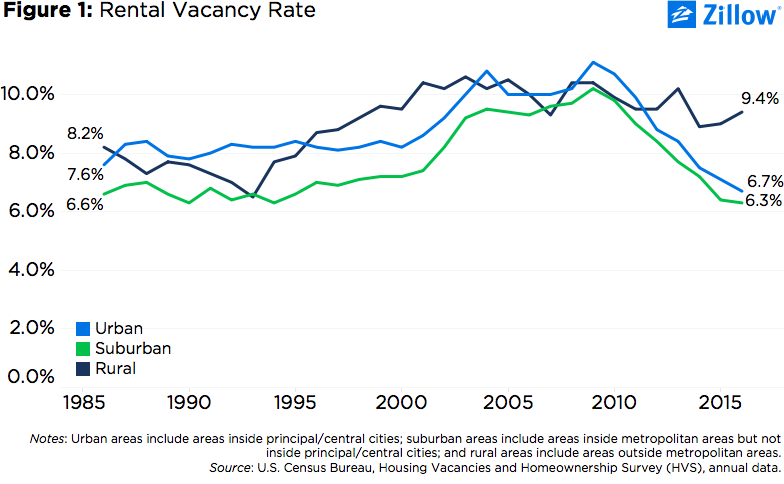
For much of the past three decades, the rental vacancy rate in urban communities was the highest in the nation. But it has declined sharply over the past five years, falling to just 6.7 percent in 2016, the lowest rate on record by more than a percentage point. The rental vacancy rate in suburban communities has also declined sharply in recent years, and now is roughly in line with series lows record in the early 1990s. By contrast, the rental vacancy rate in rural communities steadily climbed throughout the 1990s and early 2000s, and remains stubbornly high (figure 1).
In 2016, rental vacancy rates fell most in the Great Lakes region, the South and Southern California, and increased the most in New England, South Florida and Northern California (figure 2). Among the 75 markets covered, Cincinnati and Toledo, Ohio, experienced the largest drops in the rental vacancy rate; Charleston and Oklahoma City saw the largest increases. In the pricey and competitive Bay Area, the rental vacancy rate in San Francisco was unchanged, and increased by one percentage point in San Jose.
Despite some improvement in select markets last year, overall rental vacancy rates remain low, especially in booming costal markets. San Diego, Los Angeles, Seattle and San Francisco reported the lowest rental vacancy rates in 2016; Birmingham, Greensboro, Charleston and Little Rock reported the highest rental vacancy rates.
[1] These data, part of the Census Bureau’s quarterly Housing Vacancies and Homeownership Survey (HVS), were released as an annual series allowing finer-grained analysis.Source: zillow.com


 Accessibility